Christmas Eve 2010:
I was hesitating to post something on this gloomy subject at a happy time of year, but then I remembered that Christmas is all about the birth of a baby, so what could be more appropriate? I was going to put up an open letter to the Pinellas County Medical Society, but that seems less like a great idea just at the moment, so I’ll put up the summary that I had prepared from them with suitable modification.
Christmas Eve Summary
There are four cardinal papers to date that come to the conclusion that fertility is not a matter of choice but of the kinship of the parents and grandparents, and it is not the common belief that the less kinship the better but the opposite.
In On the Regulation of Populations of Mammals, Birds, Fish, and Insects, Richard M. Sibly et al. SCIENCE vol. 309 no. 5734 JULY 22, 2005 page 607 – 610 the authors looked at field studies, more than 1,000 studies that met their criteria, and compared population size with population growth rate. They expected to find that small populations grew slowly because of inbreeding depression and large populations grew slowly because of environmental effects and in between there would be a maximum. To their surprise they found no evidence for inbreeding depression in the wild. The smallest populations grew fastest. Instead of growth rate dropping as some maximum was reached, the growth rate rapidly fell below replacement rate and then leveled off.
The same pattern was found in a study of Iceland genealogies: An Association between Kinship and Fertility of Human Couples, Agnar Helgason et al. SCIENCE vol. 329 no. 5864 February 8, 2008 page 813 – 816.
An initial apparent dissenting voice came from a Danish study Human Fertility Increases with Marital Radius, Rodrigo Labouriau et al. GENETICS vol. 178 no. 1 January 2008 page 601 – 603, but this study specifically addressed the question of choice and found no effect of choice. Later they looked at greater distances and found the same relationship as the others had, which they published as Comment on “An Association between Kinship and Fertility of Human Couples,” Rodrigo Labouriau et al. SCIENCE vol. 322 no. 5908 12 December 2008 page 1634 – 1635.
I became interested in the relationship between kinship and fertility more than 10 years ago. Some years earlier I had read an article in the Saint Petersburg times that gave the number of soldiers who had fought in each war of the 20th century, how many had died in battle and how many veterans remained alive. I had known of the terrible problems returning Vietnam veterans had faced and naturally assumed that these would have resulted in a higher death rate for them. But I found the numbers shocking. It appeared that more had died after returning home than had died in battle.
Since these were my friends I cast around to find out where I could volunteer to help. To my amazement, nobody seemed to know about the increased death rate and nobody seemed to be much interested. I tried to get to the bottom of the matter and had just about given up when a friend, a veteran, died. His mother asked me to look at the autopsy report. There were as usual many diagnoses listed, but none that explained why this strong young man had died. Cirrhosis, an amputation and emphysema were mentioned, but not the fact that the amputation had been for a sarcoma. Neither cirrhosis nor emphysema was ever clinically apparent, and it was clear that the report would simply vanish into a data base with countless others. I thought, “All right. He died because of the war, and the trail is erased. I can live with that. Just one thing though. No more mister nice guy.”
I made strenuous efforts over the next two years and ultimately a study was done – quite possibly not because of me – and my impression was vindicated although perhaps not to the degree I initially thought. They were still dying. I contented myself that now that the terrible effects of combat were better understood perhaps we would lose our taste for war.
I was wrong.
I took a couple of years off my career as a diagnostic radiologist during which time I took some college courses and generally recovered my enthusiasm to reenter the clinical fray. One day as I pondered the question of why war seemed like such a recurring thing. War is not thrust on people by their leaders. People select leaders one way or another who start wars. But war is not human nature. There were thousands of years during the Neolithic period when people had weapons – the spear and the bow and arrow – that were not surpassed until the introduction of the breech loading rifle at Gettysburg. The bayonet is a spear, and gunpowder was no better than the longbow; it was just easier to learn to use. And organization on a large scale occurred during the Neolithic period. But there was no warfare. War is not our nature.
War is not an exercise that promotes the economy nor does it improve people. Why then?
It struck me that there might be some fertility advantage to being hostile to outsiders. Perhaps a sufficient degree of genetic diversity would depress fertility so that people who were hostile to outsiders had more babies. I had an uneasy feeling that civilizations did not last very long, and this might be the reason, so I looked at a souvenir wall chart I had of world history and measured off how long empires had lasted in southern Mesopotamia. Then I graphed the survival rate of empires against their ages in fifty year increments. This is what I found.
Information taken from R. H. Carling THE WORLD HISTORY CHART International Timeline Inc. Vienna, VA 1985. The experience of Southern Mesopotamia. The vertical axis is The chance of an empire of any age continuing to rule locally for another 50 years. The horizontal axis is the ages of the empires. I broke the Ottoman Empire into two, because their Janissary elite came from two different sources during the early and late empire.
I was stunned. If empires fell from external causes such as climate change or overwhelming disease of enemies, the line would be horizontal. If they fell because of intrinsic factors – their politics or culture or any advantage they might have – the line should trend upward as the less fit were removed. But the line goes decisively downward.
The cause had to be genetic or at least inherited, some sort of effect of the very fact of having a large population. Just how strong that effect was and how small a population could be and be imperiled, I did not then suspect, but it obviously was an important matter. I dismissed thoughts of the cause of war. Whether my speculation about war was true or not, the question now was of survival. It seemed to me that any intelligent person looking at the data would agree.
So I elected to drop everything else and concentrate on the issue. I had no need to return to work for a couple of years; I had saved enough for that.
I began to consult geneticists and go to conventions. There was mild interest, but nothing like what the question warranted. This was no surprise. I had been through it before with the veterans. I managed to get into communication with somebody who had access to the Iceland genealogy data. My suggestion was to take a cohort of couples, go back ten generations and count ancestors and then see how many children and grandchildren the couple had.
He understood my suggestion and agreed that this could be done without violating the privacy of the subjects of the study. Then he abruptly sent me a message that he was going on vacation and cut off communication. His email address was canceled. I had reached a dead end.
But then the Sibly study mentioned above was published. Here is a graph from it.
This is from one of the field counts of animals they amassed. Growth rate, and hence fertility, is highest with the smallest population, which is the equivalent of saying the greatest average kinship. It then falls very rapidly and levels off below replacement level. In this particular study the maximum size of a sustainable population is less than 1,000.
I felt my idea had been thoroughly vindicated and that my job was done. People would have to accept the new fact. I was briefly in communication with Dr. Sibly, but then he went on vacation and I have not had a reply from him since.
If more support was needed, it came from the Helgason study cited in the letter above. Here is the key graph. They did as I had hoped. Again I have no way of knowing whether my own attempt at input had any effect.
The vertical axis is some measure of the number of children. The horizontal axis is kinship, second cousin or closer then third cousin or closer and so forth. The highest fertility is for second cousin or closer, in other words first cousin once removed. This is not the peak for number of grandchildren. That peaks between third cousin or closer and fourth cousin or closer, which means between second cousin once removed and third cousin once removed or in other words third cousin.
I would have thought my ability to be stunned would have worn out by now, but seeing how close a relationship needed to be for the best fertility did surprise me. A second thing to notice is those error bars. They stand for two standard deviations. In other words there is almost no overlap between the number of children fifth cousins have and the number sixth cousins have. Choice and chance appear to play almost no part in how many children there are to be once the spouse is selected.
Notice also that by sixth cousins the line has fallen below replacement. By the time you are out past say eighth cousins, the whole population will be below replacement. The maximum sustainable human population under conditions of random mating seems to be below 1,000.
I wished for more clarification. I do not know whether Dr. Helgason went on vacation, but I have not been able to get a response from him.
I did not expect any further support. The definitive studies seemed to have been done. But more support did come. In the first Danish study cited above by Rodrigo Labouriau and Antonio Amorim the authors looked at the fertility of couples and compared it with the distance apart the two had been born. They found that fertility increased with this marital radius out to about 100 kilometers.
They did specifically address the question of choice. They saw that the larger the town the couple lived in – which they pointed out meant the larger the mating pool – the fewer the children. Once one accounted for the effect of this urbanicity and for the effect of marital radius, there was no further effect of income or family size on the number of children. Like animals and like Icelanders the fertility of Danes is determined by kinship not choice.
The fact that fertility seemed to be increasing with increasing marital radius – which is to say decreasing kinship – appeared to be at variance with the two articles that had already been published in which decreasing kinship resulted in decreasing fertility, so I sent a message to Dr. Labouriau asking him kindly to go back to his data and look at the relationship farther out. This he did, and the resulting graph looked like the Iceland data. There were a couple of differences. For one thing, the closest matings did show an element of inbreeding depression. For another by graphing distance rather than area his geometry was different, but this was easily corrected for and the result was a graph with the same curve..
Those four papers establish the point. What is lacking is a scientific paper or the report of some official body addressing the issue that puts them all together and makes the kind of statement that can be used by physicians taking care of patients.
The rest is based on softer data. It will include my own clinical experience, following some populations and then speculating about why evolution has done this to us and about the difficulties that must be overcome for it to be recognized.
As a diagnostic radiologist I have been asked to do hysterosalpingograms for infertility. I would inject a small amount of contrast material into a woman’s uterus and watch the uterus fill and the flow out the fallopian tubes. I could tell if the study was going to be positive when I walked into the room before I looked at the patient. The giveaway was the surgeon. If he was standing in the room, it would be a positive study. Otherwise it was going to be normal. Surgeons know what they are doing, and he would want to see any abnormal study.
Usually there was no surgeon and no diagnosis. Of course this was frustrating. An imaging procedure is done because a clinician has a question. If the radiologist cannot answer the question he ought to be able to suggest the study that will provide the answer. But I had nothing to offer. At some level my sense of professional duty was that I had failed. I did not understand the cause of the infertility. I think now I do understand, but as I indicated this is not yet a matter where one can say, “This is probably what the problem is.” So in a way, the whole past ten years has been spent trying to make a diagnosis for certain of my patients.
There are populations to follow. You have seen what happens to empires. But the fall of an empire seems to depend not on the population of the empire as a whole but on the number of administrators and officers needed to maintain coherence. Those numbers are generally not available. When I lumped the Anasazi – or Ancestral Puebloans – with the Romans and the classical Mayans I found the same pattern as found for southern Mesopotamia.
It’s the same curve.
There are exceptions. Here is the experience of Egypt.
Three dynasties made it past the 300 year brick wall. The geography of Egypt favors a limited social pool. No girls in the desert. But the usual crisis is visible as dynasties reach 300.
Getting an annual census on a human population that covers centuries is difficult. But there is one population that may be suitable. This is from a paper in which they examined a place called Long House valley and compared tree ring width with the number of occupied houses, reckoned by the C14 data of charcoal found in fireplaces, each year for the entire time that the valley was occupied.
Jared M. Diamond, “Life with the Artificial Anasazi,” NATURE, vol 419 no 6907, October 10, 2002 p 567.
The red line is their best estimate of population size and the blue line is calculated from the tree rings. The paper took the position that population was limited by rainfall and temperature and thus the amount of food that could be grown. With due apologies, I see a different interpretation. For about two centuries there are more people living there than could be fed by their estimate. Furthermore, the population increases stepwise sometimes. That cannot be natural increase. People moved in in groups. That is hard to believe if there was not sufficient food. Notice that during the final plunge there is no evidence for people moving out. Notice also that the population only very briefly exceeds 1,000.
There are two peaks, the second higher and briefer than the first and the peaks seem to skew slightly to the right. Then the population dies.
Compare that with counts of wild mice in New Zealand and Australia. Usually mouse populations there are rather stable, but occasionally, typically about a year after a drought, there is a dramatic increase, a plague of mice.
It suggests that the drought reduces the population size, fertility rises and then inevitably falls.
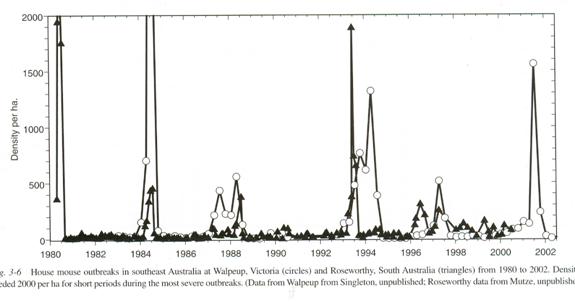
(The Mouse in Biomedical Research second edition Volume 1 History, Wild Mice and Genetics, chapter 3 “The Secret World of Wild Mice” section VI Population Dynamics part C. Population Eruptions (Mouse Plagues in Australia; population eruptions in New Zealand) Grant R. Singleton and Charles J. Krebs editors James G. Fox, Muriel T Davisson, Fred W. Quimby, Stephen W. Barhold, Chritian E. Newcomer and Abigail L. Smith Elsever Burlington 2007 page 39. The caption reads: House mouse outbreaks in southeast Australia at Walpeup, Victoria (Circles) and Roseworthy, South Australia (Triangles) from 1980 to 2002. Densities exceeded 2,000 per ha (hectare) for short periods during the most severe outbreaks. Data from Walpeup from Singleton, unpublished; Roseworthy data from Mutze, unpublished.)
Most dramatically there is usually a single very high peak. But three times the numbers do not get that high and there is a double peak, the second higher and briefer than the first and possibly skewed to the right.
Since neither study mentions fertility, one must respect the opinion of the researchers, but it would appear that there is at least a suspicion that we are looking at fertility curves in both cases.
This biggest human population is of course everybody. Here is a graph of birth rates for the whole world over the past fifty years I got from the UN.
The vertical axis is the average number of children born per woman. The horizontal axis gives the dates of the surveys. They broke the data down by economic region, most developed, middle and least developed. One gets the impression that the poorer countries are having more babies and that birth rates are decreasing overall. The most developed countries are not able to produce enough babies to sustain themselves, and this has been going on for about thirty years. My patients come to mind. This is serious enough. But if you tamper with the graph by following the poorest countries until their fertility overlaps with the middle countries, drop back and follow the middle countries until they overlap the richest, cut and paste, what you get is this.
We are all in the same boat. We are all following the same curve. The data suggest that we are all experiencing the same mechanism of infertility, only some of us being farther ahead on the curve. And of course as the world has become richer mobility has increased and people are on average marrying people they are less and less related to. There is also a cumulative effect.
The population studies in isolation do not prove the case, but they are quite consistent with the effect we saw before, which was proven.
A question that arises is why evolution should have done such a terrible thing to us. Evolution is selection of successful populations, yet it appears here that success only means increasing mating pool size causing falling fertility, causing population collapse and at least a very strong chance of extinction. That is very odd.
But consider this. If you isolate two populations for a long period of time and then reintroduce them, they will have become distinct species. I know of no consensus on how long it takes, but my guess is about 1,000 to 10,000 generations. Forgive me for not having references at this point, but I have read that studies of mice in the Canary Islands indicate from chromosome patterns that every valley has a different species. Mice were only introduced at the time of Columbus or about 500 years ago. I would suspect that the average generation time of wild mice is less than six months, which would mean 1,000 generations, but it is certainly more than a month because that is how long a mouse takes to mature and reproduce. Let us say a minimum of two months or 3,000 generations. So somewhere in there the mice underwent speciation, nobody knowing how long ago.
It has been suggested that rabbits in the Azores, also not dating back farther than Columbus, are a different species from European rabbits from whom they descended, so the same arithmetic holds. I once met the head of the biology department at the university of the United Arab Emirates. I asked him how long a camel generation time was. He said that traditionally people milked camels, which suppressed ovulation so that the generation time was quite long, something like seven years. I once read that the Bactrian two humped and the one humped Dromedary camels had been separated for about seven thousand years and that when crossed they produced fertile offspring but after a few generations hybrid breakdown supervened and the line died out. They thus appear to have undergone speciation rather recently. Again this suggests about 1,000 generations to speciation.
My references are not in hand and I may be mistaken in memory. Two thousand generations to speciation would not surprise me. Ten thousand generations to speciation would seem like an impossibility for mice and rabbits, but there may enormous variation in the time it takes. From what I have read people remain the same species far past 1,000 generations, but presumably evolution has devised the mechanism for a worst case scenario.
For argument’s sake let us say it takes 1,000 generations.
So assume a valley with 1,000 rabbits. One rabbit has four offspring. The first has two offspring that mate with each other. There will probably be inbreeding depression. The second offspring also has two offspring and their offspring do not mate for four or five generations. There should be no problem. The third of the offspring hops over to the other side of the valley. The climate changes. The valley is divided by a glacier for 1,000 rabbit generations. Eventually at generation 1,000 an offspring comes back, but it is now a different species; there are no fertile offspring with any local rabbit. The fourth offspring mates at random and so do its descendants. On average it will be about 1,000 generations before its descendants mate. The same speciation effect will deny them fertile offspring. Since this is true of the whole valley, the whole valley dies out.
This catastrophe might be averted by assuming a very long speciation time, but since things are always changing, environmental niches opening and closing, grossly delayed speciation would put a species at a disadvantage.
The solution evolution appears to have come up with is to introduce a very robust mechanism that reduces fertility when a population gets large enough to be dangerous to itself and to others with which it might mingle. The mechanism will most likely simply eliminate such a population. That is harsh, but nature can be harsh. What we have been looking at appears to be such a mechanism in action. It simply has to be there if we are to survive in the long run. Evolution has been around a long time and must have encountered the problem many times before.
So the logic seems compelling. The hard science is on line, although I trust much will follow. For instance the effect is too fast for DNA mutations – they would be the cause of speciation but the mechanism here must outrun speciation – and my current best guess is that the process involves epigenetic effect, that it to say the control of genes rather than the genes themselves. This needs to be explored. The experience of history and of populations seems consistent at the very least. This is something of great importance that affects how people live and the choices they make. It would seem that one need but mention it to a few people and the word should spread like wildfire.
This has not been the case. I am not sure why, but I suspect that there are two problems. The subject is taboo. It is worse than taboo. It is double taboo. A taboo object is one that fascinates, that both attracts and repels, and for no good rational reason but with lots of emotion.
The first taboo is the incest taboo. Some cultures are more severely opposed to it than others. (The Red Lamp of Incest, Robin Fox Universtiy of Notre Dame Press Notre Dame Indiana 46556 1983) Some have even encouraged it. But everybody notices. So there is probably a hardwired incest circuit in our brains. We all notice it. Of course the present issue has nothing to do with incest. It is a matter of marrying reasonably close cousins, not members of the nuclear family, but when did prejudice ever have to make sense? So if you start talking about the subject, the shagreen of taboo emerges and your friend gets very uncomfortable and wishes the subject be dropped.
The other taboo is the racism taboo. One can be expected to be challenged by the question, “So you mean we shouldn’t marry other races?” No, that is absolutely not what I mean. Races as usually understood include enormous numbers of people. This is an effect that works out on a much smaller scale. Studies have shown that people who deny any sort of racial prejudice can be shown to harbor negative attitudes towards those who are different even if they are unaware themselves. (The Role of Social Groups in the Persistence of Leaned Fear Andreas Olssom, et al. SCIENCE vol. 309 no. 5735 page 785 – 795) There could well be another hardwired reflex that can be called into play for race as well as for incest.
Besides, one can be a cousin to someone of a different race and not be a cousin of someone of the same race. It is just not relevant. At no time in all the data I have looked at have I thought, “Ah, this could be an effect of race.” But start talking about it and the racism taboo takes over. It makes people uncomfortable.
I strongly suspect that bringing the subject up violates both taboos at the same time. That is discouraging. Nobody wants to think about such things. It is discouraging, but I believe it can be done. The death rate of veterans was once a taboo subject.
One can only try.
There have been 8,224 visitors so far.