Meeting of the American Society of Reproductive Medicine
Convention Center, Orlando, Florida
October 15 through October 19, 2011
I. What I knew before the meeting.
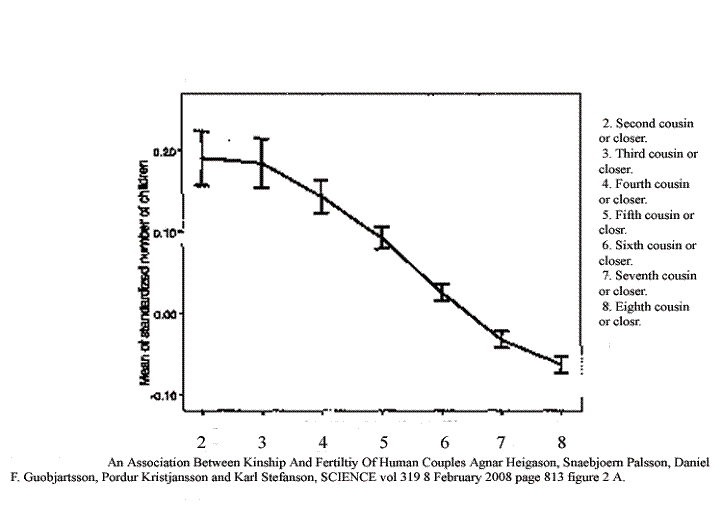
A study was done in Iceland comparing kinship of a couple with fertility. They calculated kinship by going back ten generations and counting how many ancestors the couple shared. Sure enough, kinship has an effect. By and large, the closer kin the more children. This of course is not what common belief is.
(That’s “Helgason.” Sorry.)
The error bars are very tight. There can’t be much else determining fertility. If kinship is inadequate, this might be pre-zygotic infertility. (Fertility cased by an event that happens before egg and sperm get together and form their zygote.) That is what is bypassed by in vitro fertilization (IVF).
Not only is the number of children affected. The number of grandchildren is affected at well.
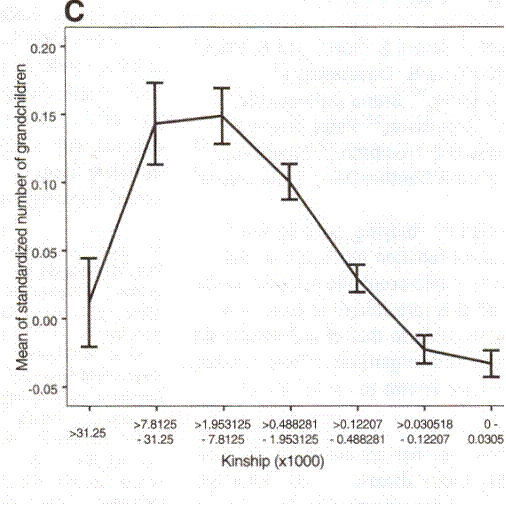
An Association Between Kinship And Fertility of Human Couples, Agnar Helgason, Snaebjoern Palsson, Daniel F. Guobjartsson, Pordur Kristjansson and Karl Stefanson, SCIENCE vol. 319 8 February 2008 page 813 figure 3.
Without claiming to have done a formal statistical analysis, it looks to me that most of the limited variation in the first graph is accounted for by the variation in the second graph and vice versa.
This time it must be post-zygotic infertility at work. Between the two processes, this effect accounts for the bulk of clinically significant infertility. Of hysterosalpingograms I have done, all but a tiny fraction were quite normal. Before they came to me, every other known cause had been excluded. So mostly infertility happens to otherwise normal women and is much more common than loss of another function, such as vision or hearing in spite of being more important from an evolutionary standpoint.
That is how things appear to be from the paper. However, this is a major paradigm shift. There are a number of things that must be accomplished before a paradigm shift can be accepted. 1) There must be an enormous amount of data in support of it. 2) There must be a plausible mechanism. 3) There must be evidence for the mechanism. 4) The new paradigm must be consistent with first principles. 5) There must be a key experiment done; some thing must be predicted that cannot be explained on the basis of standard belief and then that must be demonstrated in fact; simple retrospective interpretation will not suffice. 6) There must be about thirty years of interest in the issue.
This proposed shift has another problem. It is inherently distasteful.
All of us have strong social attraction to certain other people. The notion that we might need to consider anything else in mating choice does not make anybody happy. There is a discredited school of thought called “Eugenics.” I am no expert, but from what I understand there were three principles. a) It matters to your children what your mating choice is. I have no problem with that idea. Courtship is all about deciding who would make a good mate. b) It is a bad idea to marry outside of one’s “race.” At no place in my work have I found any evidence of this. Race simply seems not to be an issue. In this I am in agreement with most educated people. c) One must never marry a cousin. On that point it seems that eugenics was completely wrong. Within limits marrying kin is an advantage.
So this is not eugenics. It is the opposite. But it is still distasteful. We would rather have complete discretion in our mating choices. I think we do, and we should, but I think we must understand the implications of our choices; else we are not truly free.
To continue with evidence: This is not just something odd about Iceland. The same effect is visible in Denmark. They compared the distance between birthplaces of a couple with their fertility. This is what they found.
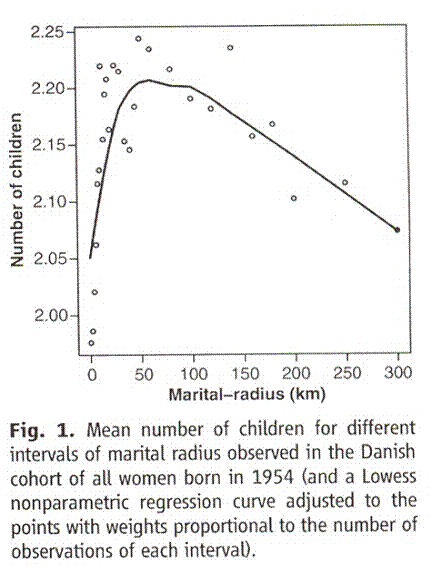
Comment on “An Association between Kinship and Fertility of Human Couples,” Rodrigo Labouriau and António Amorim, SCIENCE vol. 322 no. 5908 December 12, 2008 page 1634.
The shape of the curve is different because they looked at area not distance. This time they had more evidence of inbreeding depression, which of course we know to be real. This time there is probably a combination of pre-zygotic and post-zygotic infertility.
And it is not something peculiar to humans. A study was done accumulating all the serial field counts of animal populations in the wild in the literature. There were more than a thousand they found fit for analysis. They found the same curve.
This time they did not find inbreeding depression although we know it exists. How much of this is pre-zygotic and how much post-zygotic is not clear as it is not clear in the Danish study.
I submit that the thousand and more animal studies combined with the two human studies constitute ample evidence for at least a suspicion that this may be important.
To continue with a mechanism:
What about humans? We need an isolated but unlimited population of humans followed with annual census for centuries. Fortunately there is one that is pretty good. Jarred Diamond did a study in the Southwest of a place called Long House Valley. It was occupied for centuries by Native American Anasazis. The team found every dwelling ever used and did carbon fourteen dating on all the charcoal to estimate during which years each house was occupied and thus obtain an annual census.
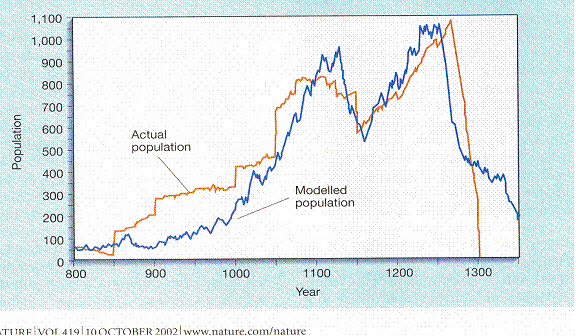
Jared M. Diamond, “Life with the Artificial Anasazi,” NATURE, vol 419 no 6907, October 10, 2002 p 567.
No European has ever managed to survive in the valley by farming, so it seems clear that these were expert farmers. The “actual population” is the annual census described. The “modelled” (sic) population is actually the tree ring width. The two track indicating either that the population is limited by the weather and growing conditions or they are cultivating the trees. The former is his interpretation, but as you see, people move into the valley in groups. There are vertical rises. Since it seems unlikely that people moved in and built houses when the locals were starving, we will go with the tree cultivating idea. It looks as if people moved in and arguably never moved out. There are no vertical falls that stand out against the natural curve. Plague, famine or war also would give a vertical drop, but they appear to have been spared these calamities. None the less, they die out.
Since the curve is not truncated, it appears that they were never limited by food. The curve looks like a combination of pre-zygotic infertility and post-zygotic infertility just as the Iceland data suggest.
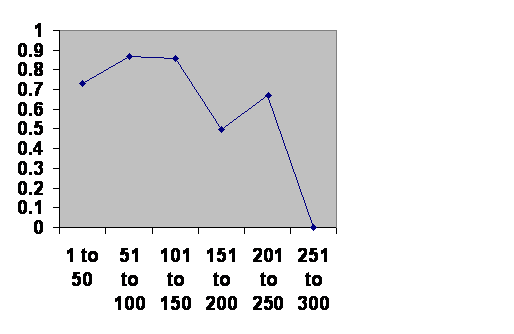
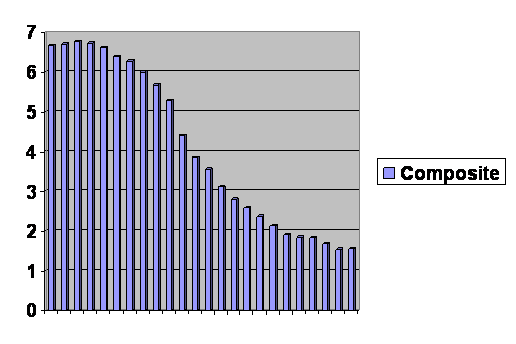
The same curve can be seen in the survival of Chinese dynasties (assuming that a decline in the numbers in the imperial household increased the risk of a dynasty failing.)

Information taken from John B. Teeple TIMELINES OF WORD HISTORY, DK Publishing, New York, NY, 2006, page 554, 555 Chinese dynasties. The vertical axis is the chance that a dynasty of that age will survive another 50 years. The horizontal axis is the age of the dynasties.
The numbers represent the chance of the dynasties surviving in fifty year increments. Notice that there is a notch is the same place where the Anasazi had a decline.
Here is the same information for Japanese dynasties.
Information taken from John B. Teeple TIMELINES OF WORD HISTORY, DK Publishing, New York, NY, 2006, page 554, 555 Japanese dynasties. The vertical axis is the chance that a dynasty of that age will survive another 50 years. The horizontal axis is the age of the dynasties.
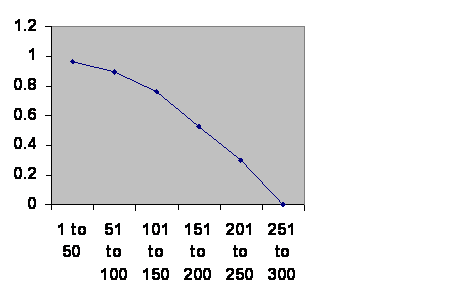 The notch occurs at the same time. There seems to be a brick wall at about 300 years of 10 generations. This is not peculiar to Oriental potentates. Here is southern Mesopotamia.
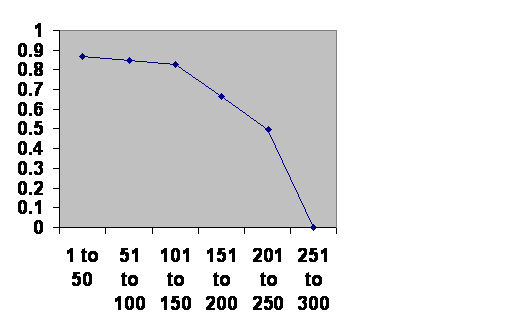
Information taken from R. H. Carling THE WORLD HISTORY CHART International Timeline Inc. Vienna, VA 1985. The experience of Southern Mesopotamia. The vertical axis is The chance of an empire of any age continuing to rule locally for another 50 years. The horizontal axis is the ages of the empires.
 And this pools the classical Mayans with the Romans and the Chaco Canyon Anasazi.
Information taken from BBC and Tainter.. The age of each regime when it fell is on the horizontal axis in 50 year increments. The vertical axis is its chance of surviving that half century after it has entered that half century. If the viability of a regime had nothing to do with how long it was since it was founded, the line would be horizontal. If regimes get better at surviving as they are, the line would rise.
So we are all in the same boat. A large population that is unstructured, like the elite of an empire, will usually die out by about 300 years. In the latter two examples, the notch is blurred out because the population may have become large before they took over the area in question.
I have found four exceptions. China, as you see, broke the 300 year barrier by a small margin. Ancient Greece did by a larger margin. Egypt broke it substantially three times. And England ripped the rule up and ate it. Each of these places saw amazing developments in science, art, technology, philosophy and so forth, culminating in the Industrial Revolution. Each culture’s endurance can be explained on the basis of restrictive mating strategy, but it would take a while.
We still have only a crude idea of the mechanism and no reason evolution should have pulled this one on us.
The mechanism appears to be epigenetic. DNA mutations just do not happen fast enough to produce an effect so fast, visible change present at only fifty years.
The effect of epigenetic changes on fertility has been documented in inbred plants. (Elizabeth Pennisi Epigenetics Linked to Inbreeding Depression SCIENCE vol. 333 no. 6049 September 16, 2011 page 1563 reviewing work by a team led by Philippine Vergeer, Hugens Building, Room HG 01.132, Radboud University Nijmegen, Molecular Ecology, Heyendaalseweg 135, 6525 AJ Nijmegen, The Netherlands p.vergeer@science.ru.nl ) What they found was that if plants that had been subjected to inbreeding to the point of inbreeding depression were sprouted in an environment with a demethylating agent (removing the most common epigenetic effects) the deleterious effect of the inbreeding was completely removed. Well if inbreeding depression is an epigenetic effect, why not outbreeding depression, and if in plants, why not humans?
Illustration from the article cited above.
So much for evidence of a mechanism. We will now attempt to base the existence of the phenomenon on first principles.
The reason population sizes should be limited by a mechanism seems mysterious, but it should not. Evolution can not go far without speciation. If evolution is good, then speciation must be good. Any life form that abandons it cannot go far. Speciation seems to take about 2,000 generations, (or maybe up to 4,000, but it makes no difference to the argument).
 Consider a valley with 1,000 animals, say mice. One mouse has a particular normal chromosome.
It replicates, 
 and the two copies wind up in two offspring
of the original mouse. One mouse scurries across the valley, and while it is there the climate undergoes an abrupt change. A glacier splits the valley in two. The glacier remains for two thousand mouse generations and then melts. The F2,000 mouse from the far side of the valley returns and mates with an F2,000 mouse from the near side. But they cannot have normal fertile offspring. They have undergone speciation in that time.
 ........................................
G
l
a
c
i
e
r ![]()
 ...........................
![]()
 ...............................................
Now, instead of a glacier, the mice mate at random throughout the valley, the population being constant at 1,000. Since there are 2,000 copies of the chromosome it takes on average 2,000 generations before F2,000 mates with F2,000. The offspring are not fertile. Since this is true of every chromosome in every mouse, the population dies.
The chromosomes never even knew the glacier was there. They just don’t recognize each other. Obviously this is an event that evolution will not tolerate, so a preventive mechanism supervenes. This mechanism keeps population sizes low enough for safety by limiting fertility of larger populations. It appears that if things get too out of hand the population is reduced or simply wiped out long before speciation effects set in.
So much for first principles.
(At this point there is a puzzle. I had read that IVF produces demethylation of sperm, and since some epigenetic effect – most likely methylation – seems to have a profound effect on fertility, how in the world is it possible that the children created by IVF can grow up to be fertile adults even by natural means with people who have not been so conceived? I had heard somewhere that there is a process by which the original methylation pattern is returned to the sperm, or at least appears in the offspring even though there does not seem to be anything the sperm is carrying other than its own DNA that could supply the information. I learned more about demethylation at the meeting.
Incidentally, this appears to be a global issue; we are all in the same boat. Here is a graph of data I pulled from the UN. They broke the world into rich, middling and poor areas and gave the numbers for their fertility each year for the past fifty.
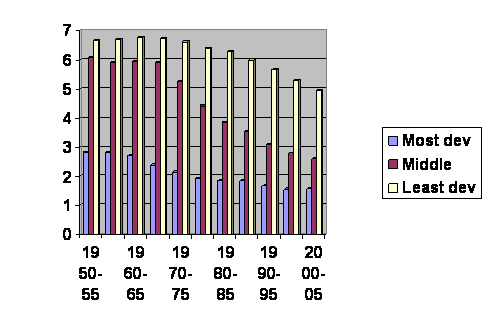
The vertical axis is the average number of children born per woman. The horizontal axis gives the dates of the surveys.
If you follow the least developed countries until their fertility is the same as the less developed, jump over to the less developed and follow them to the place where they overlap the most developed and then follow them – cut and paste as needed – you get this:
You can’t even tell where the edits are. Clearly we are all going to the same place, we are just at different points along the curve. But there is an anomaly. The last number for the most developed countries rises just a bit, but still it should not. We haven’t started marrying cousins. Maybe this improvement is due to IVF.)
II. That is what I knew, or thought I knew, going into the meeting. I wanted to learn five things.
A. It seems to be high time to do the key experiment and prove that this effect of kinship and fertility is active in human populations and contributes to clinical infertility. I hoped to meet somebody who could propose an experiment and might even be interested in doing it or would know somebody who might. The only thing I can think of would be to find a few women who had failed to become pregnant with ICSI even using healthy donor sperm. It might be possible to exploit the effect of the fertility of third cousins as shown by the Iceland paper. If it worked, it might give strong support to the notion that kinship is a factor. But a negative result would not necessarily prove that kinship (or the lack) is not a factor. From a scientific standpoint it would not be a very good experiment. From a clinical standpoint, however, it might be helpful.
B. The birth rate in the developed world is rising. How much of that is due to ICSI or other means of assisted fertility?
C. What is the success rate of children conceived with ICSI, particularly those who failed to conceive with other means of in vitro fertilization, in having grandchildren?
D. What is the story on demethylation of sperm?
E. What is a good textbook on fertility?
III. The answers I got to my questions.
A. I spoke briefly with lecturers and at more length with other attendees. Nobody had a suggestion for a critical experiment. However I hope I learn something from future communication.
B. I did not get actual numbers on how much of the rise in fertility in the developed world is due to assisted fertility, but I gathered that it wasn’t much. This has now been confirmed by a letter I have received from the UN.
C. Children conceived by in vitro fertilization have no more difficulty than anybody else having children. However, ICSI is only 15 years old as a technique. So the question of whether a person conceived with ICSI after failure by ordinary in vitro fertilization is similarly fertile remains open.
D. 15 % of the DNA is a sperm undergoes demthylation, apparently by having the histone protein stripped from it. This is not, so far as anybody can tell, affected by the means of fertiltization.
E. Bought one.
Yes, there is more data. There is the phenomenon of mouse plagues in New Zealand and Australia. There is the experience with black footed ferrets being reintroduced into the wild. There is the Easter Island experience. There is the deer mouse sperm coupling. And there is the computer simulation of the fertility of virtual populations of varying sizes. You already get the picture, but I include them as a sort of an appendix.
Appendix (so to speak)
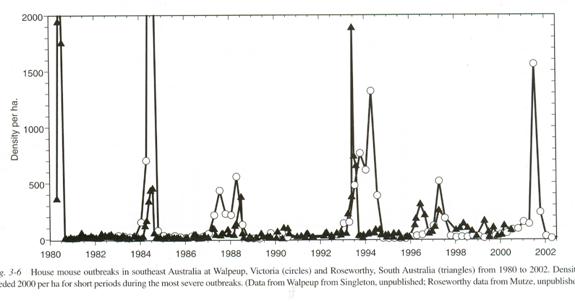
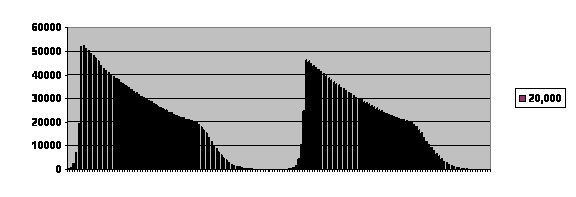
The Mouse in Biomedical Research second edition Volume 1 History, Wild Mice and Genetics, chapter 3 “The Secret World of Wild Mice” section VI Population Dynamics part C. Population Eruptions (Mouse Plagues in Australia; population eruptions in New Zealand) Grant R. Singleton and Charles J. Krebs editors James G. Fox, Muriel T Davisson, Fred W. Quimby, Stephen W. Barhold, Chritian E. Newcomer and Abigail L. Smith Elsever Burlington 2007 page 39. The caption reads: House mouse outbreaks in southeast Australia at Walpeup, Victoria (Circles) and Roseworthy, South Australia (Triangles) from 1980 to 2002. Densities exceeded 2,000 per ha (hectare) for short periods during the most severe outbreaks. Data from Walpeup from Singleton, unpublished; Roseworthy data from Mutze, unpublished.)
Sometimes the plagues are very intense, possibly recruiting multiple mouse populations. Sometimes they are smaller, possibly representing only one local population that has started reproducing rapidly. With these, the familiar notched curve is visible. Preditors and food supply have been ruled out as causes of the ends of the plagues. Papova virus has been suggested, but the stereotyped time course argues against that.
2.
This is a computer simulation of a post zygotic infertility influence population undergoing two cycles. Notice the delay before the second cycle, the rise of which is greater than exponential.
Compare that with the results of a reintroduction of ferrets into the wild:
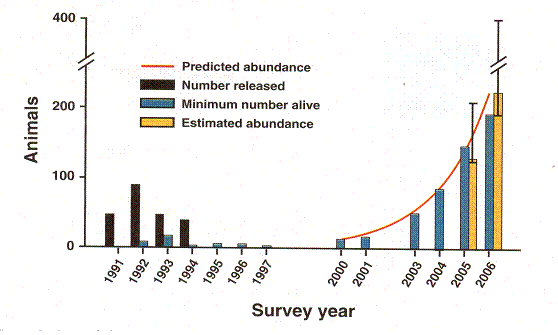
Rapid Population Growth of a Critically Endangered Carnivore. M. B. Grenier, D. B. Macdonald and S. W. Buskirk SCIENCE volume 317 10 August 2007 page 779 figure 1. The vertical black bars are the number of black footed ferrets released. The vertical grey bars are the number counted. Years of release or counting are along the horizontal axis. There is again the delay before the more than exponential rise.
3.
The Easter Island experience. The advent of Europeans is marked with the big arrow. The time scale is different, but this is not a homogeneous society. Those famous statues represent families, at least according to Thor Heyerdahl, who actually went and talked to the locals.
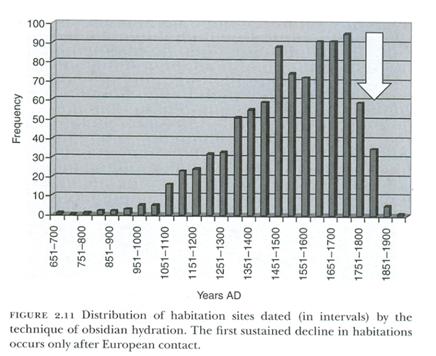
Chapter 2 Terry L. Hunt and Carl P. Lipo ”Ecological Catastrophe, Collapse, and the Myth of “Ecocide” on Rapa Nui,” Questioning Collapse, Cambridge University Press, Cambridge 2010. The curve looks familiar, but the time course is different.
4.
These deer mouse sperm have formed flying wedges, something they will do with kin but not with non-kin, which lets them advance faster.
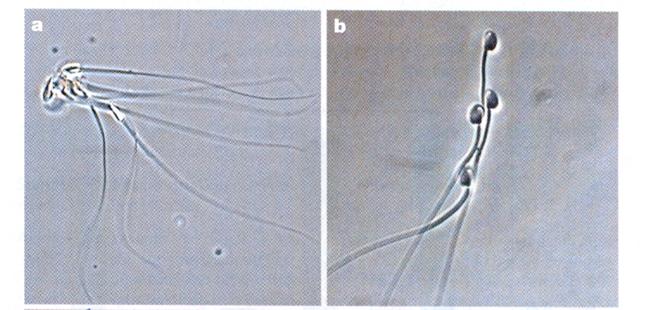 Pictures from Competition Drives Cooperation Among Closely Related Sperm of Deer Mice, Heidi S. Fisher and Hopi E. Hoekstra, NATURE vol. 463. no. 7282 February 11, 2010 page 801.
If sperm can recognize kin, maybe ova can. This would be a pre-zygotic phenomenon.
5.
Graph of Growth Rate against Population Size
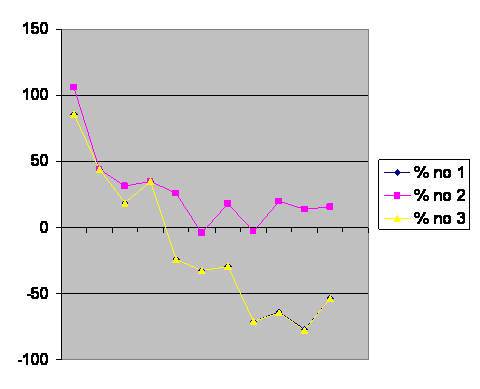
These are the outcome of a set of computer simulations under pre-zygotic rule of populations of different sizes, increasing toward the right. Higher fertility toward the top of the vertical axis. There were three ways to calculate fertility on generation 1,000. a) Top line. Eliminate all populations that had gone extinct and average what was left. b and c) Double bottom line. Instead of averaging final number of offspring, add them up and divide by the starting number AND allow for the fall from a finite number to zero as something that needs to be subtracted from the crude average.
There have been 29,276 visitors so far.