Fluctuation of fertility with number in a real insect population and a
virtual population
M.L. Herbert1* & M.G. Lewis2
1Volunteer Department, Pinellas County Health Department, 205 Dr M.L. King Street North, Saint Petersburg,
Florida 33701, U.S.A.
2Clinical Pathology, USF College of Medicine, 12901 Bruce B. Downs Blvd, MDC 2, Tampa, Florida 33612, U.S.A.
and Sun Pathology, PA, 6501, Pasadena Avenue North, Saint Petersburg, Florida 33710, U.S.A.
Real fruit fly fertility increases with average consanguinity thus decreasing with population
size in a pattern that is modelled successfully with a virtual population. This invites the
deliberate manipulation of wild insect populations for the control of vectors of human
disease.
Key words: fruit fly, Drosophila melanogaster, disease vector, mosquito, malaria, dengue,
population control, insect control, pesticide, gene pool size.
INTRODUCTION
Population growth rate in animals is related to
population size so it would be helpful if this effect
could be used in the control of insect populations.
Insect-borne diseases are a serious health issue,
and insects can be killed by such things as insecticides
but this typically results in a population
larger than ever. Our captive population of
Drosophila melanogaster showed a cyclic rise and
fall not consistent with a simple equilibration process
and that could be duplicated with a computer
program. There is an opportunity for empirical exploitation
of this and it could serve as an experimental
model for elucidating the mechanism.
It has been established that in wild populations,
the growth rate of the population is largely determined
by population size (Sibley et al. 2005).Asimilar
pattern is seen in humans (Helgason et al. 2008)
or can be inferred in humans (Diamond 2002) and
during mouse plagues (Singleton & Krebs 2007)
because of a similar time course of the population
size.
We reasoned that if this effect was robust and
widespread that it could be used to manage wild
insect populations. We were motivated by the
thought that insect-borne human diseases are
important and that any means that might be used
to control the insect numbers might have desirable
results for human health. Accordingly, laboratory
fruit flies were raised in a large cage and their
population size was followed. We found that the
time course of the population size was predictable
enough to invite such a management attempt.
Since the effect can be demonstrated in the laboratory
the opportunity exists to work out the cause
of the connection between population size and
thus average consanguinity on the one hand and
fertility on the other.
We suspected a pre-zygotic epigenetic mechanism,
one that happens before the ovum is fertilized
since sperm have been shown to recognize
kin sperm (Fisher & Hoekstra 2010) and thus
might well recognize related ova. In the event
there is evidence for a post-zygotic mechanism so
the distinction remains equivocal.
MATERIAL AND METHODS
Our starting material consisted of 16 lines of
commercially available laboratory fruit flies that
had been raised in isolation from each other for
their value in having distinctive phenotypic traits.
These traits were not of interest to us, but the fact
that they had been isolated from each other permitted
us to establish an outbred population. The
chosen lines were designated by the supplier as
wild type, bar, scalloped, vermilion, white, white
miniature forked, yellow, black, cinnabar, sepia,
white apterous, white vestigal, dumpy, lobe, scarlet
and ebony and designated by us as A to P, respectively.
Sexes were separated, and crosses were made in
four sequential generations by the scheme A × B,
B × C, C × D …P × A. Then we bred AB × CD,
BC×DE, CD×DE…NO×PA. The next generation
was ABCD × EFGH, BCDE × FGHI, CDEF ×
African Entomology 21(1): 119–125 (2013)
*Author for correspondence. E-mail: mlherbert@aol.com
GHIJ…PABC×DEFG and finally ABCDEFGH×
IJKLMNOP, BCDEFGHL × JKLMNOPA, CDEF
GHIJ × KLMNOPAB … PABCDEFG × HIJKL
MNO. This resulted in 16 lines, ABCDEFGHIJK
LMNOP, BCDEFGHIJKLMNOPA, CDEFGHIJKL
MNOPAB … PABCDEFGHIJKLMNO. These
initial generations were raised in standard laboratory
vials on commercially available fruit fly
medium with water and yeast.
When the crosses had been completed, the vials
were placed open in a cage of sheer fabric over a
wood and hardware cloth frame. Light mittens
were sewn into the fabric. A pass-through was
placed with one door opening into the cage and
one outside. Observation windows were included.
The system was plumbed for vacuum so that the
cage could be vacuumed or the pass-through
flushed of insects. This plumbing did not prove
necessary.
The dimensions of the cage were 89 cm high
56 cm wide × 152 cm long. The pass-through
measured 32 cm high × 30 cmwide × 55 cmlong.
There were 8 shelves suspended in the cage
measuring 54 cm × 47 cm. Counts were taken on
two areas of observation window each measuring
13 cm × 12.5 cm. Bottles in the cage measured
5 cm × 5 cm × approximately 11 cm and were
initially filled with four ounce measures of culture
medium and five ounce-measures of water with
about 32 grains of yeast. When the vials were
placed, four culture bottles were placed with
them. To these four more were added daily. After
one week the vials were removed. Each day all the
bottles were moved. Bottles that were 28 days old
were removed. Counts were made at about 08:00
everymorning before the flies had been disturbed.
For 10 days counts were also made after the flies
had been disturbed.
Each month two of the bottles being removed
were emptied and for two days allowed to accumulate
flies that had eclosed. These were then
collected and kept until they had produced
maggots to verify their fertility. Then they were
taken for histological study. One of the bottles was
treated with isopropyl alcohol and kept. Twice,
from 23 August to 26 October 2009 and from 1 November
2009 to 12 May 2010, supplementary food
was given in the form of a dish with six ouncemeasures
of medium and eight of water. This
supplement was replaced weekly. A bowl of the
foam vial stoppers soaked in water was always
present in the cage and was changed as needed.
The room temperature and humidity were
controlled. Illumination was through windows
with blinds drawn so that direct sunlight did not
enter. The room lights were rarely turned on
except when the observations and bottle changes
were being made. The original lines were maintained
in vials on a table in the same room and
none of the original lines died out.
Ten days of counting before the flies were disturbed
totalled 401 flies. The same 10 days of
counting after the flies were disturbed totalled
1024 flies. The interior area of the cage was
54 048 cm2. The counting areas together had an
area of 326 cm2. They constituted one part in
165.8 of the available surfaces excluding the
shelves, which remained essentially vacant except
for the edges. The proportion of flies that were
present initially was one part in 2.554 of those on
the windows after they had been disturbed. Some
flies remained in bottles after the disturbance;
these were not taken into account. Flies avoided
the pass-through possibly because bottles being
removed were tapped on the pass-through to
clear them of flies. Flies tended to accumulate on
the edges of the shelves. Some remained in the air,
particularly after they had been disturbed. It was
not deemed feasible to increase the accuracy of the
census by taking these flies into account. So the
best estimate of the actual number of flies would
be reached by multiplying the raw counts by the
correction for window size, the correction for flies
remaining in bottles and dividing by seven days of
pooled counts, or by multiplying raw pooled
counts by 24.
No evident effect was seen on the counts that
could be attributed to the supplementary feeding,
seasonal changes, the weather over a week or the
few occasions when dead flies were vacuumed
out.
For histology, collections of intact Drosophila
were received in 10 % neutral buffered formalin
for fixation. They were then processed in a standard
method using an automated processor for
embedding in paraffin. Sections were cut at 5 μm
approximately. Multiple levels were placed upon
glass microscopic slides and cover slipped in the
usual fashion. The sections were stained with
haematoxylin and eosin prior to examination
under a Leica™ compound microscope.
To better understand the process, a computer
program was constructed using C++ language
that created a virtual population with fertility
120 African Entomology Vol. 21, No. 1, 2013
decreasing with decreasing consanguinity and
increasing population size using both a pre-zygotic
mechanism and a post-zygotic mechanism.
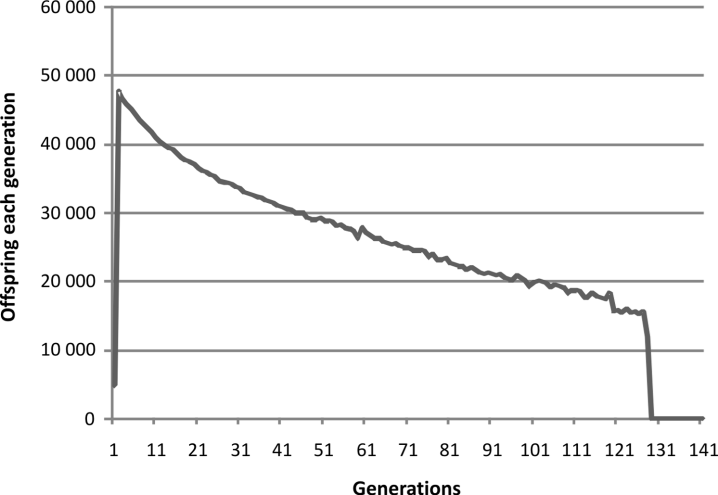
Parameters for the post-zygotic mechanism were a
single simulation that lasted 1000 generations of
which only the first 79 are shown. There were 100
in the population at the outset with a maximum of
1000 each generation. Each pair could have up to
100 offspring. There were 100 sites subject to
changes affecting post-zygotic fertility with a
change rate of 2100 per site per 100 000 generations
with a loss of 2100 one thousandth of an offspring
per unit of mismatch.
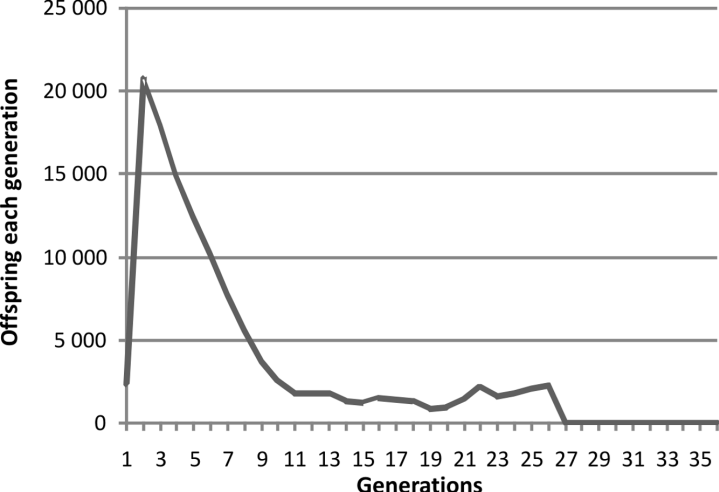
Runs were done with the same program using
only the pre-zygotic mechanism. Parameters for
the pre-zygotic mechanism were a single simulation
that lasted up to 1000 generations. There were
100 in the population at the outset with a maximum
of 100 each generation and then on repeat
simulation 1000 each generation. Each pair could
have up to 100 offspring. There were 100 sites
affecting pre-zygotic fertility with a change rate of
5000 per site per 100 000 generations with a loss of
500 one thousandths of an offspring per unit of
mismatch.
Further runs were done employing both the
pre-zygotic mechanism and post-zygotic mechanism
at the same time. Parameters for the combined
mechanism were a single simulation lasting
up to 1000 generations. There were 1001 in the
population at the outset with a maximum of 1000
each generation and on repeat simulation 50 each
generation. Each pair could have up to 100 offspring.
There were 100 sites affecting pre-zygotic
fertility with a change rate of 500 per site per
100 000 generations with a loss of 500 one thousandths
of an offspring per unit of mismatch.
There were 100 sites affecting post-zygotic fertility
with a change rate of 2100 per site per 100 000
generations with a loss of 2100 one thousandths
of an offspring per unit of mismatch.
RESULTS
Two years of daily counts were obtained on our
captive fruit fly population. Daily counts were
pooled on a weekly basis and the resulting population
changes graphed in Fig. 1.
There is a short series of peaks in which the
peaks are successively lower in linear fashion and
the valleys are successively lower in linear fashion
with the peaks skewed to the left. Then the population
size becomes less predictable.
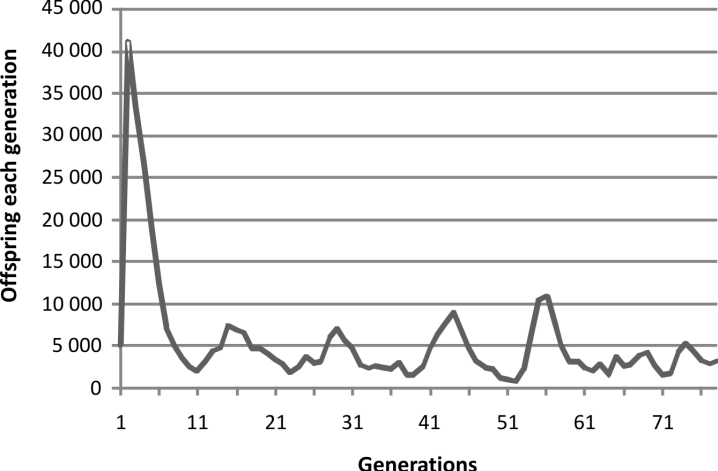
When our computer program that created a
virtual population with fertility decreasing with
decreasing consanguinity and increasing population
size using a post-zygotic mechanism was run,
the results shown in Fig. 2 were obtained.
In the initial stage of growth, the real population
started after four generations of outbreeding. In
the virtual population initial growth started from
what was a virtual clone with all members
optimized for maximum fertility so, as would be
expected, the initial growth of the virtual population
rose disproportionately high. Then there was
a short series of peaks, each peak lower than the
last and each valley lower than the last in linear
fashion and the peaks skewed to the left. Then the
Herbert & Lewis: Fluctuation of fertility with number in virtual and real insect populations 121
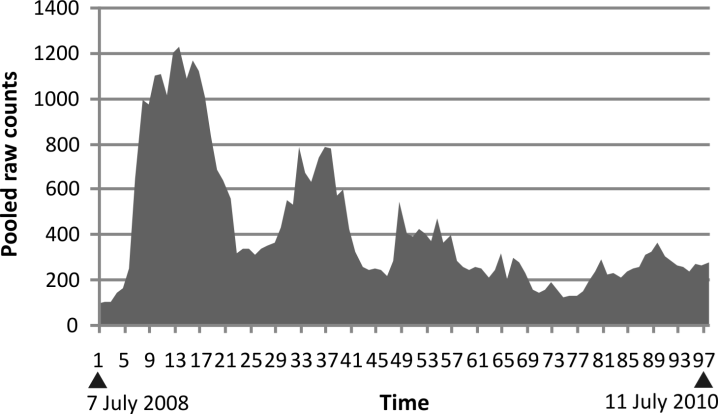
Fig. 1. Raw counts pooling both windows for two weeks. The vertical axis is the accumulated counts. The horizontal
axis is time. Counts started on 7 July 2008 and continued to 11 July 2010.
population size began to wander. This was true for
both the real population and of the virtual population.
This matched closely the pattern observed in
the experiment, so we have evidence for a simple
mechanism producing post-zygotic infertility and
need invoke nothing further. That is not to say that
this elegant match will happen every time either
in the virtual world or the real world. Specifically
in the simulation the decline in the valley heights
was not consistent. The numbers are higher and
the statistics are better in the experimental model
both with regards to population size and presumably
at the molecular level. Still it is only one
history. Possibly a repeat attempt would be different.
Oneobvious hypothesis is that the population in
each case is undergoing adampedoscillation seeking
equilibrium. But this is not possible because
that would require the peaks to fall, which they do,
but also that the valleys must rise, which they do
not.
The same pattern using a simulation with a
pre-zygotic mechanism was not obtained. Rather
the pattern was as in Fig. 3.