Chance of surviving the next 50 years.
Age of the empires in years.
The TNS meeting:
I recently returned from the General Global Gathering of the Triple Nine Society or ggg999. The society is a social club with the requirement being any adult if an IQ in the 99.9 percentile or one per thousand. On listening to a discussion of membership I made a rough calculation in my head roughly as follows: Population of the US: 300 million. Number of Americans with any interest at all in joining any social club: 1% or 3 million. Number who are too young, too old, too infirm, too poor or members of a disaffected minority about 100 million leaving: 2 million. Number able to pass the entrance requirement of about 150 IQ on any of a number of tests that are accepted: 2 thousand. Number of Americans in the club: 1,000 (and a like number in Europe as well as a scattering elsewhere) So roughly half of potential members are in fact members. You will not find another group as large with IQ’s as high as the ggg999. In the event, hurricane Mathew threatened Orlando, and although the weather was mild many flights were canceled so that the whole meeting was actually about 60.
What follows is part of my lecture; I am leaving out my own recent research.
I must give you a Word version, since Dreamweaver seems reluctant to accept a PowerPoint file.
999
Orlando Meeting
2016
In about 1574-1596, the Ottoman Empire changed the way they recruited the Sultan’s personal guard, the janissaries. They had become so powerful that they were effectively one of the ruling classes, rivaling the Turkish aristocracy, one even becoming Grand Vizier, effectively ruling the empire. For our purposes then the Ottoman empire is effectively two successive regimes.
Before I give the title of the talk, let me describe the first graph. Were I to show you a picture of men slaughtering babies, you would be offended, and I apologize even for bringing it up, but this first graph is far worse.
It will be all of history starting with the first stirrings in Ur in lower Mesopotamia and remaining there until into the 20th century. The horizontal axis will be the ages of the empires broken into 50 year increments, and the vertical axis the chance that any empire of that age will survive another fifty years. They shape of the line will be determined by whatever theory of history you espouse. Why do civilizations fall? If there are multiple effective causes, the line will be very noisy. If there are one or two causes that arise outside of the population such as invasion, plague or drought, the line should be horizontal, failure being unrelated to the age of the civilization. If the causes arise within the population such as genes, bureaucratic mission creep or the wrong religion or laws, selection should drive the line upward, at least until the end. So what do you expect to see? And so the title:
Population Collapse
Here is the promised graph:
Chance of surviving the next 50 years.
Age of the empires in years.
Information taken from R. H. Carling THE WORLD HISTORY CHART International Timeline
The line is very clean, such as you would expect for a physics experiment. And the line goes down. Since it is not inside the population nor outside, the can only be due to the very fact of a large population. The biggest thing I brought to Orlando is not in my car, nor is it outside my car. It is my car.
This is no fluke.
This pools Rome, the classical Mayans and the Anasazi.

Information taken from BBC and Tainter. Same axes.
Chinese Dynasties:
Information taken from John B. Teeple TIMELINES OF WORD HISTORY, DK Publishing, New York, NY, 2006, page 554, 555 Chinese dynasties. The vertical axis is the chance that a dynasty of that age will survive another 50 years. The horizontal axis is the age of the dynasties.
Japanese dynasties:
Information taken from John B. Teeple TIMELINES OF WORD HISTORY, DK Publishing, New York, NY, 2006, page 554, 555 Japanese dynasties. The vertical axis is the chance that a dynasty of that age will survive another 50 years. The horizontal axis is the age of the dynasties. I is humbling to reflect that Western civilizations are less durable on average than Chinese and Japanese dynasties. Notice the notch. It occurs at exactly the same time. We shall see it again.
It is not just politics. Here is a graph modeling outbreaks of insects in Canada.
Detailed studies of the natural history of Pissodes strobi, and of the recovery and defect formation in its coastal host, Sitka spruce was used to develop a computer model, Spruce Results of the Spruce Weevil Attack (SWAT) simulation model showing the dynamics of weevil population, represented by the number of eggs laid on leaders and resulting damage (number of killed leaders) through the life of a Sitka spruce forest from plantation to harvest. In this model, weevil population is regulated by the availability of long leaders (a proxy for food supply), which are more prevalent during the juvenile stage of the stand. © 2015 Her Majesty the Queen in Right of Canada, as represented by Natural Resources Canada Insects affecting regenerating conifers in Canada: natural history and management René I. Alfaro,1 Alvaro Fuentealba Can. Entomol. Vol. 00, 2015
Here is more insect data:
Where the numbers are good, lots of counts, we again see a rapid rise and a slower fall that tails off. This time there is the beginning of a rebound after the population crashes. Comparative ecology of conifer-feeding spruce budworms (Lepidoptera: Tortricidae) V.G. Nealis Can. Entomol. 00: 1–25 (2015)
© 2015 Her Majesty the Queen in Right of Canada, as represented by the Minister of Natural Resources
Area of defoliation (millions of ha) by (A) spruce budworm in eastern Canada (Newfoundland and Labrador, New Brunswick, Nova Scotia, Prince Edward Island, Québec, Ontario), (B) spruce budworm, two-year cycle spruce budworm, and western spruce budworm in western Canada (Manitoba, Saskatchewan, Alberta, British Columbia, Yukon, Northwest Territories), and (C)© jack pine budworm in Manitoba (MB), Saskatchewan (SK), Ontario (ON), and Québec (QC).
They go up fast, down slow and then tail off. It’s not food supply. In the first graph the insect numbers are declining while the number of new shoots is still going up; it’s a young forest and the big curve is the number of shoots off the main stems of trees.
So why? That a big why. And if it’s true of oriental potentates and Canadian bugs, it can’t be hard to find.
Consider a new niche and two animals in marginal niches that might exploit it, they will begin to optimize for it:
![]()

One will get there first and have an advantage in competing for the niche: the other may go extinct so selection is a contest. It happens under time pressure.
Now suppose one species splits in two:
One new species can remain optimized for the old niche and one be efficiently selected for the new. What’s worse, while the species in red is displaced, another may undergo speciation and take its old niche. It could go extinct even though its niche never changed.
Speciation is a contest with the prize being a head start in the selection regatta.
Now there is a problem.
Consider a valley with animals and two closely related chromosomes, the most closely related chromosomes in the population. It gets cold. The valley is cut by a glacier that lasts 2,000 generations or whatever the time to speciation; it’s probably longer with insects but the logic does not change:
For a time the animals on opposite sides of the valley cannot reach each other, but when the glacier melts animals from one side can meet animals from the other, but they cannot have fertile offspring. Speciation has occurred. This is called allopatric speciation.
But now instead of getting cold, the weather gets warm. Animals can move all around the valley and they mate at random. The population rises to 1,000. There is something called “genetic drift.” Sometimes a gene, or for us a chromosome, simply does not get carried over into the next generation. For now we shall imagine that this has been turned off.
Assume that the two chromosomes shown are the most closely related chromosomes in the population there at the beginning. Now it takes 1,999 or about 2,000 generations for the two chromosomes in question to find each other. Again, they cannot have fertile offspring. Since this is true for every chromosome in the valley, there is a population crisis; the population may die out.
If we turn genetic drift back on, the situation is somewhat mitigated, but these were the most closely related chromosomes. The others are already on the way to becoming extinct from speciation effects. So it’s a wash.
Rapid speciation comes at a cost. Mating pool size must remain small. People in civilizations ignore this rule; that’s why civilizations die out.
This has been published: R. Fox, “Marry in or Die Out” in Handbook on Evolution and Society, J. Turner, R. Machalek, A. Maryanski, Eds. Paradigm Publishers, Boulder, 2015, chap. 19.
We don’t believe in extinction of the fittest so there is selective pressure to put in a fix. Here it is:
A team led by a man named Sibly looked at 1,700 serial field counts of mammals, birds, fish and insects. They found a consistent pattern. There is a point at which growth is zero; at least potentially, other things being right, the population will be stable indefinitely. For humans, of course, this would be most desirable. If the population rises above that point, there is negative growth, which slowly becomes more negative farther from the rest point. If the population falls lower than the rest point, population growth rises rapidly.
Sibly did not find inbreeding depression in the wild, possibly because he excluded from analysis populations that went extinct while being studied. The population size resulting in no growth has not otherwise been published for any species; maybe there’s a paper in it if you can find it in your favorite insect model.
The same curve has been found in Denmark
considering family size on the vertical axis and marital radius (distance between birthplaces of couples) on the horizontal. This time the team looked specifically for evidence of choice but found none. One issues of kinship – town size and marital radius – are controlled for, there is no effect of income or education on fertility. Despite the many issues humans consider, when it comes to family size we slavishly follow the dictates of kinship of the couple and of their ancestors. Presumably insects do as well.
Taken from Comment on “An Association between Kinship and Fertility of Human Couples,” Rodrigo Labouriau and António Amorim, SCIENCE vol. 322 no. 5908 December 12, 2008 page 1634. For the whole story also see Human Fertility Increases with marital radius. Rodrigo Labouriau and António Amorim. GENETICS volume 178 January 2008 page 603.
The line looks different because they used distance. Square the distances for area, which must be proportional to population and inverse to kinship, and you get the same curve.
So like everything else, humans must follow the Sibly curve.
As I said, if a population is not at rest at the balance point, it must change. I do not have a grand theory that shows how one pattern of change follows another as population size changes. (If you can do it, there’s a paper in it for you. *) The history of the population and chance play a part. I do have some rather anecdotal patterns that can to a certain extent be modeled with a computer program. The program models a population that is following Mendelian laws of inheritance and has mechanisms that regulate fertility according to kinship; there are two such possible.
As you know, egg and sperm unite to form a zygote. Anything that interferes with the two combining and making a zygote is “pre-zygotic infertility.” Anything that interferes with the zygote maturing to form a fertile adult is “post-zygotic.”
 One pattern is of course inbreeding depression. Here is a computer simulation using mixed pre-zygotic and post zygotic mechanism. Population was limited to 3 with number of offspring
each generation on the vertical axis and generations on the horizontal:
I do not regard this as a satisfactory model. It just looks like a noisy system that dropped below 2 because of statistical chatter.
We do not know enough about inbreeding depression. One thing we do know is that it is not due to genes. It is epigenetic in nature. A team led by Philippine Vergeer, Hugens Building, Room HG 01.132, Radboud University Nijmegen, Molecular Ecology, Heyendaalseweg 135, 6525 AJ Nijmegen, The Netherlands p.vergeer@science.ru.nl ) inbred some plants until they had inbreeding depression. Then they raised the plants in an environment with a chemical that is known to strip methyl groups. Methyl groups are a known mediator of epigenetic effects. The inbreeding depression went away.
I have previously been involved with a paper: Herbert, M. L.; Lewis, M. G., Fluctuation of Fertility with Number in a Real Insect Population and a Virtual Population, African Entomology 2013 21(1), 119–125, that indicated that at least in my hands pre-zygotic infertility does not contribute to inbreeding depression. So that leaves post-zygotic infertility.
If there is ever an occasion to try to rescue a population threatened with extinction by outbreeding with post-zygotic infertility or to get local extinction of a population, we shall need to know a lot more about inbreeding depression.
Another pattern is simply a constant population, neither growing nor declining. Here is a computer simulation of one that has both pre-zygotic and post-zygotic mechanisms at work:
Flattish with population limited to 100.
There is a hiccup at first, probably because a population was developed under slightly different conditions – population limited to 200 – and then brought in. The number of offspring per generation is very noisy but goes nowhere in particular.
Nature does a better job. This is a collection of counts of wild mice in Australia. They monitor for mouse plagues, which do happen, but most of the time the mouse population is rather stable.
G. R. Singleton, C. J. Krebs, “The secret world of wild mice” in The Mouse in Biomedical Research, J. G. Fox, M. T. Davisson, F. W. Quimby, S. W. Barhold, C. E. Newcomer, A. L. Smith, Eds. (Elsever, Burlington, ed. 2, 2007), vol. 1, chap. 3, p. 39.
It is not held in check by environmental limitations; the mice have plenty to eat even at the height of a plague. Predation was ruled out. The authors suggest papova virus affecting the peaks but have no explanation for the flat areas.
Another pattern is damped oscillation. This can be found, not very impressively, with both pre-zygotic and post-zygotic mechanisms in play:
Offspring
Generations
This is the pattern modeled with a pure post-zygotic mechanism; it is not as noisy.
The pattern, such as it is, tends to be marked by rapid rise and slow fall.
This is the pattern modeled with a pure post-zygotic mechanism; it is not as noisy.
There is damped oscillation with rapid rise and slow fall. We might have guessed this from the shape of the Sibly curve.
The same pattern was demonstrated by us in the lab using fruit flies and published in the same article in African Entomology:
M. L. Herbert, M. G. Lewis, Fluctuation of fertility with number in a real insect population and a virtual population. African Entomology 21, 119-126 (2013).
The damped oscillation has been shown in wild European voles; it is not clear what the slopes are:
Counts on the vertical axis, time on the horizontal.
T. Cornulier et al. Europe-wide dampening of population cycles in keystone herbivores. Science 340, 63-66 (2013).
 Another pattern, quite hard to reproduce with computer simulation, is two peaks leading to extinction. Here is one attempt:
As usual, we have offspring on the vertical axis and generations on the horizontal. The second peak rises higher than the first and then the population dies. In this run, with these particular parameters, slope is still rapid rise and slow fall.
Here is a different run with different parameters published in that same paper:
Offspring:
Generations
The fist peak is exaggerated because of unrealistic starting conditions, but this time we have slow rise and rapid fall, at least on the second peak. It would be nice to have the best of both graphs, and I’m working on it.
Each of these double peaked curves requires that both pre-zygotic and post-zygotic mechanisms be employed.
Here is a graph of farmers in a place called Long House Valley in the American West. The horizontal axis is the year. The vertical axis for the red line is the number of occupied houses that year as estimated from carbon 14 dating of charcoal in the hearths.
Jared M. Diamond, “Life with the Artificial Anasazi,” NATURE, vol. 419 no 6907, October 10, 2002 p 567
You can see stepwise rises; evidently these people move in groups. There is no obvious stepwise fall, so apparently nobody moved out and there was no famine or war. The blue line is rainfall as estimated from tree-ring thickness. Since it seems unlikely that the weather was following the population size, I believe that they were cultivating the trees. Pretty as you please, the pattern is slow rise and rapid fall with the second peak higher than the first.
The same tw0 peaked pattern is seen twice among the wild Australian mice. Watch out; it looks like three times, but two of those lower peaks are from different counting stations.
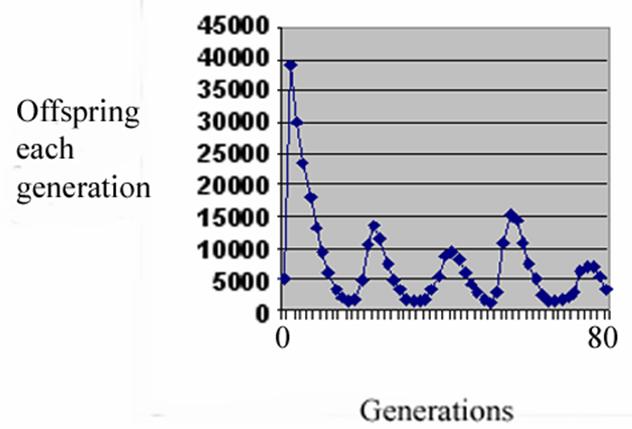
And getting back to where we started from there is the single peak curve:
Offspring
Generations
There is the rapid rise with slow fall, tailing off as we saw in the first graphs. In this case, the program is running a combination of pre-zygotic and post-zygotic mechanisms.
Here the program is set to run only a post-zygotic mechanism. I ran two curves together trying to match the two peaked curve but could not.
Offspring
Generations
As we saw in the wild, the population can sometimes recover. The period of low and stable population apparently is inbreeding depression, a better example than our first.
We recognize the same pattern among mouse plagues:
It has been shown in the lab, although attributed to psychological effects of crowding. Calhoun, who did the study proposed a test: that excessive social contact would bring down civilization in the 1990’s. Whether that has happened is up for debate.
. J. Calhoun, Death squared: the explosive growth and demise of a mouse population. Proceedings of the Royal Society of Medicine 66, 80-88 (1973).
These are UN numbers for total fertility of the whole world broken down by wealth.
I downloaded the numbers in 2010. I have been unable to find them since. Total fertility is on the vertical axis, dates on the horizontal, the poorest are shown in yellow the next poorest in red and the rich countries in blue. Don’t start putting faces to these lines. You know from the Mesopotamian data that ethnicity is irrelevant, and from the Danish data that wealth and education are irrelevant. Besides, North Korea is on the top line and South Korea on the bottom. Now we edit the data:
We follow the yellow line until it is the level of the red, skip back and so forth.
So watching 7 births per woman fall steadily and then tail off ought to be familiar. We are all in this together, and we know where it’s going. Maybe there’s a paper in it for somebody if they can retrieve the original data.
Doom and gloom, doom and gloom. While we’re here, let’s wallow in it a bit. You can go to gapminder.com and set up a graph showing age at first marriage for women on the vertical axis and fertility on the horizontal and then run it over years up to 2005. What happens is that just about every country has a fall in total fertility, starting at different times and not relenting until it has fallen below 2. After that there may be some fluctuation, but it never goes back over 2. As it falls below 2, age at first marriage for women starts to rise inexorably. There is no fluctuation. Sweden just about leads the parade and the two numbers we need to hold on to are that in 2005 the average woman was marrying at age 33 and this was rising at a year every three years. AT that rate, she should reach age 40 and births should essentially stop in another 21 years or about 2026. Sweden is sturdily middle class and quite likely represents the middle class worldwide irrespective of average in come for a nation. If she is 40 in 2026, she was born in 1986, and if you wanted to change anything, you had to do it before then; her infertility, both pre- and post-zygotic was fixed at birth. But you have to go back to when her parents married, which determined what her infertility would be, and even before that, when here mother fell in love age 14, she probably didn’t marry the guy, but she was always looking to find him in somebody else. If the mother was, say, 30 when the last fertile woman was born, at fell in love 16 years earlier, that’s 16 years before 1986 or 1970 when the fertility of the last fertile woman was established.
But starting to work at 1970 would only save one year’s worth of people. You need to save a whole generation, or 30 years worth, which goes back to 1940. And it is probably unrealistically optimistic to say you can persuade half the people in 10 years, but taking such a rosy view, you had to begin work in 1930, obviously this is too late to save the rich world.
We’ll trace the rich world back to 1960, when it is about the same as the middling world in 2005. Now we trace it back 30 more years to 1975. Women born in the middling world then are now 40, so don’t look for a lot of children thence. So your target is women born among the poorest of the poor before 1995. They are now 20. They fell in love 5 years ago. It is just too late for them. You have to go back another five years. You can’t save a whole generation. Whether a society can survive 5 years of no children is quite problematic, but it may be worth a try.
Of course you must work in environments where you couldn’t send an army, and must compete with Christian and Muslim missionaries who are ready to put their lives on the line.
If you can save a significant number of them, you have the task of transferring the wealth and technology of the rich world to them with a less than enthusiastic rich world. And you have to teach them things that are utterly new to them while making it clear that they dare not break of their old circle of mating choices.
Best of luck.
There you have it.
I'm sorry. I don't seem to be able to attach the movies; maybe you can get to them by going directly to gapminder.com.
There have been 214 visitors over the past month and YouTube has run “Babies Triumph over Evil” 262 times.